Last updated on 12 May 2026
Web and multimedia have contributed to the mapping of assets to make it a great pedagogical tool to explain sometimes complex situations. Animations, multimedia complements, interactivity with the reader make them first-rate educational tools. Proof with three examples of maps dedicated to current confits. 3 particularly spectacular talking cards.
Table of Contents
Cyberthreat Real Time Map.
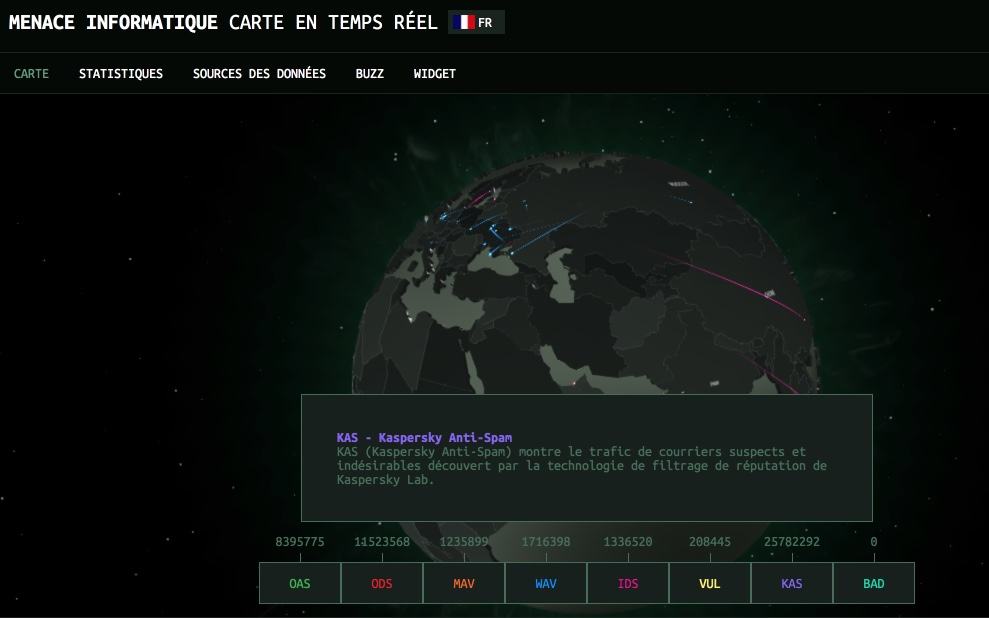
It is a deaf and violent war that takes place every day on computer networks.. A 3D map developed by one of the giants of computer security that identifies and allows to visualize in real time the current computer attacks. The reader can interact with the map by manipulating it with the end of the mouse to focus his interest for example on a given country or place. Spectacular.
Link: Cyberthreat Real Time Map
LiveuMap

Another map of the planet that vibrates to the rhythm of conflicts around the globe. LiveuMap offers a real-time map that shows all ongoing geolocated conflicts related to news reports from major international agencies. Eastern countries, Middle East, refugees, Syria…everything is there. Each element is represented by a small badge which gives information on the nature of the event. One click and you get the related information. A little anxious, but terribly effective. LiveuMap also offers apps for your iOS or Android smartphone.
Link: LiveuMap
ResourceTrade

It is one of the main causes of the conflicts that are shaking our planet: international trade. ResourceTrade is a spectacular interactive map for studying international trade and commerce. The map uses lines of different sizes and colors to represent the exports and imports of different countries between them. A filter system by criteria above the map allows for refined results for a country, region, sector or period. By hovering the mouse button over one of the lines, the map displays all the related numbers. Useful.
Link: ResourceTrade