Last updated on 12 May 2026
Charttt is a brand new online tool that greatly simplifies the creation and sharing of diagrams or charts. The service was originally designed to allow a diagram to be integrated into emails, blog posts, websites, chatbots, social networks etc.
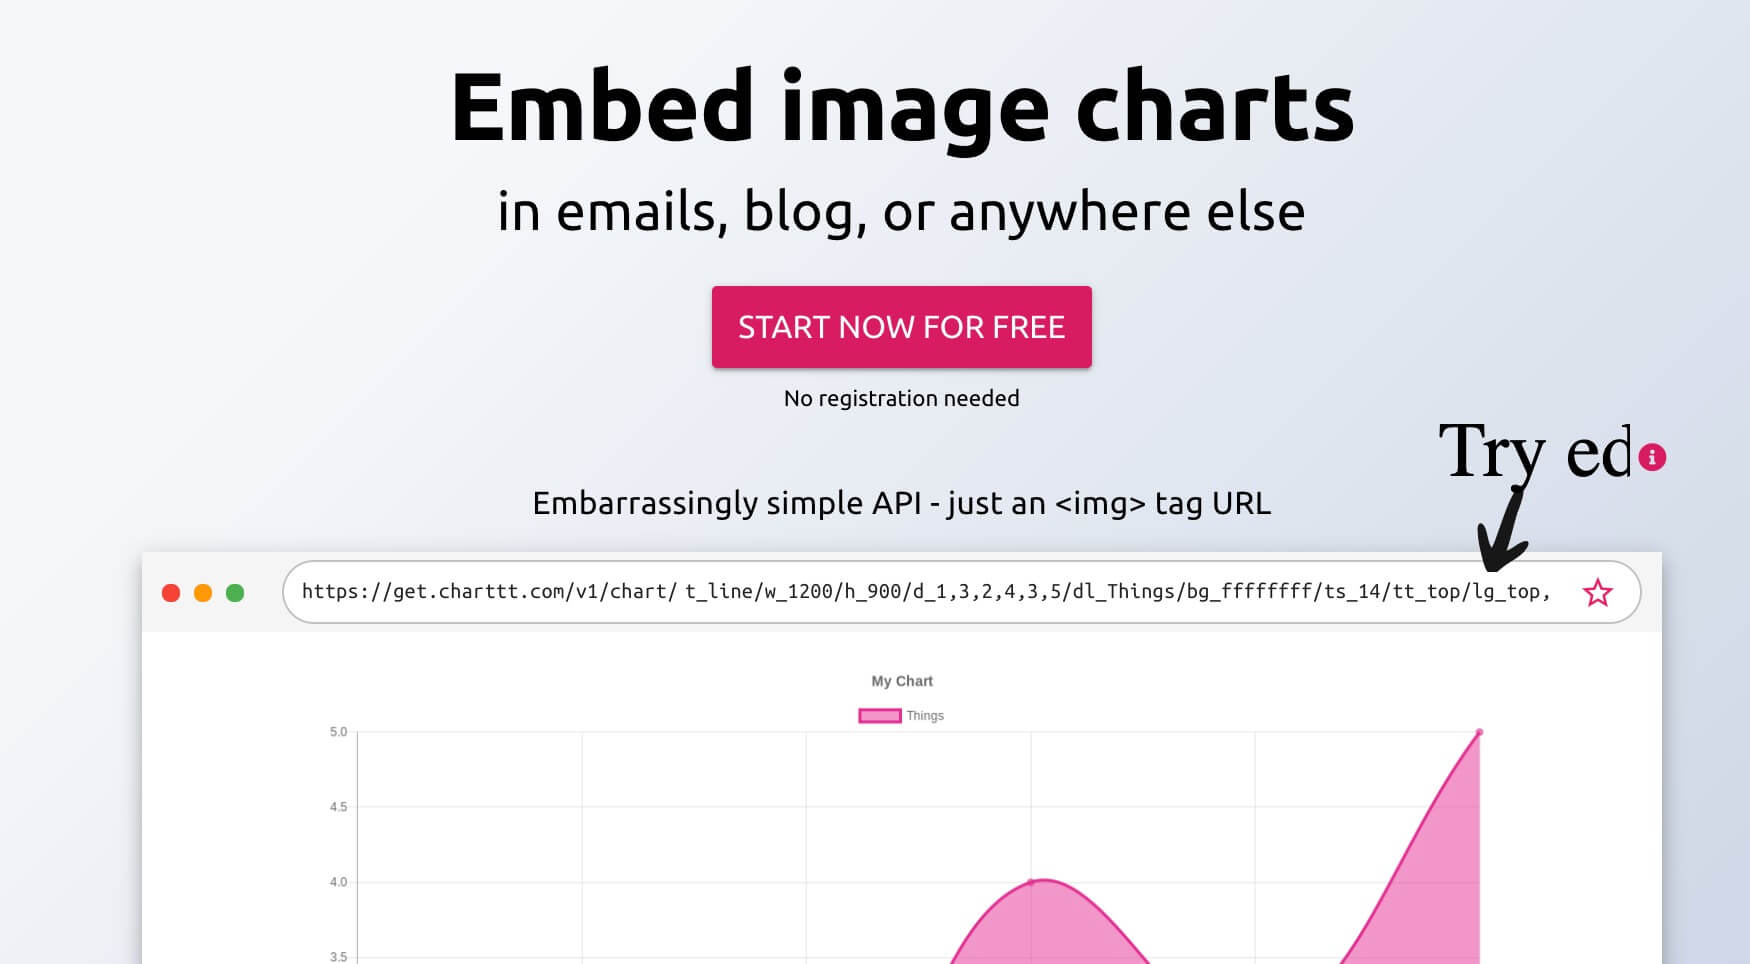
It also offers a graphic designer very simple to take in hand and use. A good solution to easily create and share diagrams without complicating your life too much.
An easy-to-use online graphics editor
Chartt provides you with a free online chart generator to create bar charts, line charts, and much more. In reality, you can generate nine types of diagrams to visualize your data. Linear charts, circular charts, bar charts, horizontal bar charts, … dispersion charts to cover most needs.
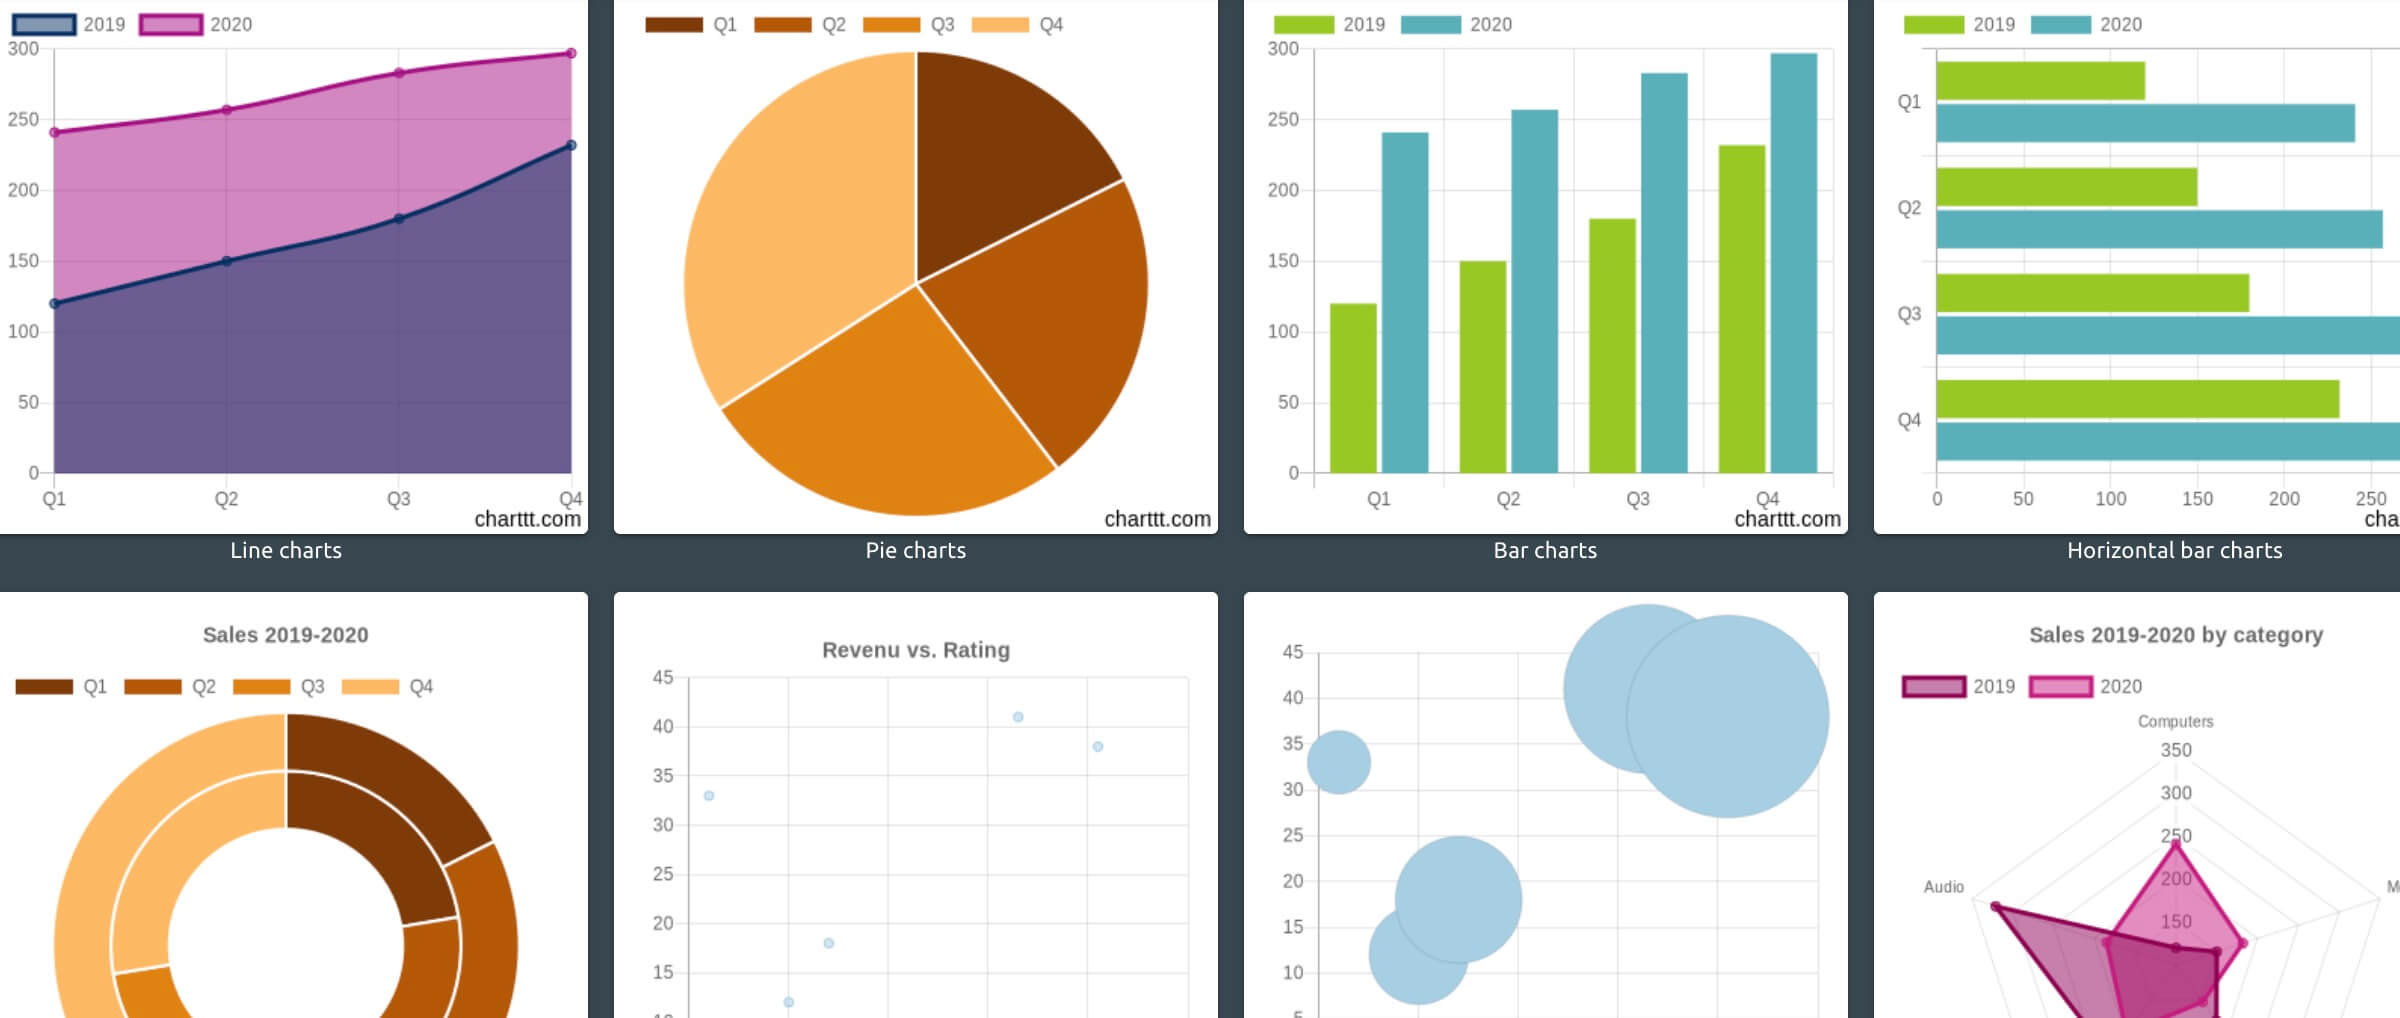
The editor is a model of simplicity thanks to a direct preview function of the result obtained as you enter or modify the data.
Simple diagrams to create but also to share
Charttt’s other great strength is the ease with which you will then be able to share a graphic created from its editor online. Thanks to a very efficient API, your chart can be broadcast in high definition in most digital channels.
Charttt makes it easy to insert a graph into an email, a newsletter, a website, a Slack mailbox or an interactive PDF.
You can test for free Charttt but you will have to accommodate a small logo of the application on your creation and a limited number of diagram types. For 1 Eur per month you will blow up these . limitations
Also read: If you want to have another option for easily create a graph with data, you can also take a look at the Beam service

 English