Last updated on 24 May 2025
You've already wasted an infinite amount of time searching for the right pattern Mitosis, the one that sticks to your chapter? Or tried to draw a molecule on the board, under the half-amused, half-perplexed gaze of your students? If you teach science – SVT, physics-chemistry or mathematics – you know how clear and precise visuals can change …, but how difficult it is sometimes to find good ones.
The solution may be in a new online platform called Illustrae. It stands out from other tools by a very stupid but crucial thing: It is only designed for science. No funny stickers or fancy fonts here. Just an AI that understands what you mean when you type. Cross-section of a holly leaf at the midrib. ". . . And Illustrae serves you a real scheme, faithful to scientific standards. All in a few minutes.
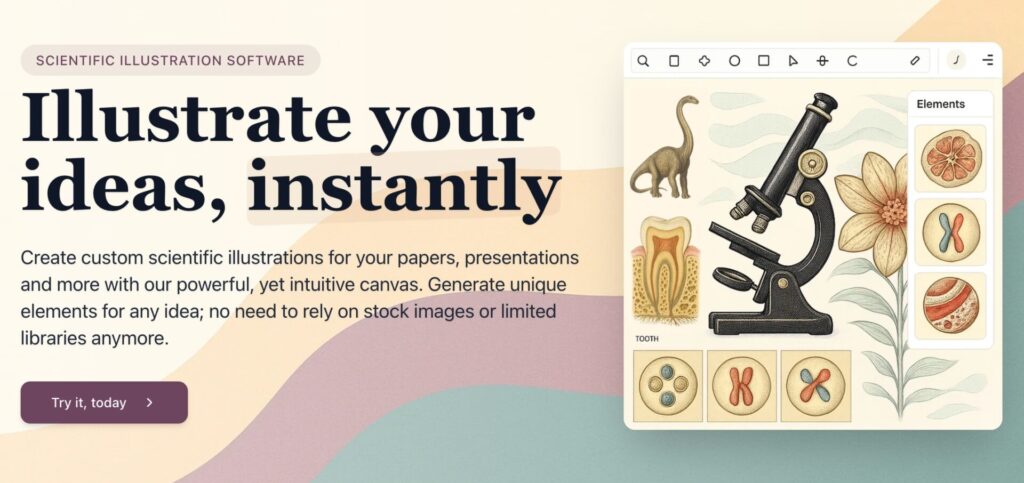
Illustrae is not just another tool. He is a visual assistant who thinks science, speaks science and draws science.
Table of Contents
Illustrae: the specialist in scientific illustration
Illustrae is not yet another graphic design tool. It is a platform designed specifically to meet the needs of scientific and pedagogical communication. His AI was formed on a large body of scientific illustrations, allowing him to understand and reproduce the visual codes specific to each discipline.
There are three types of creation available to you:
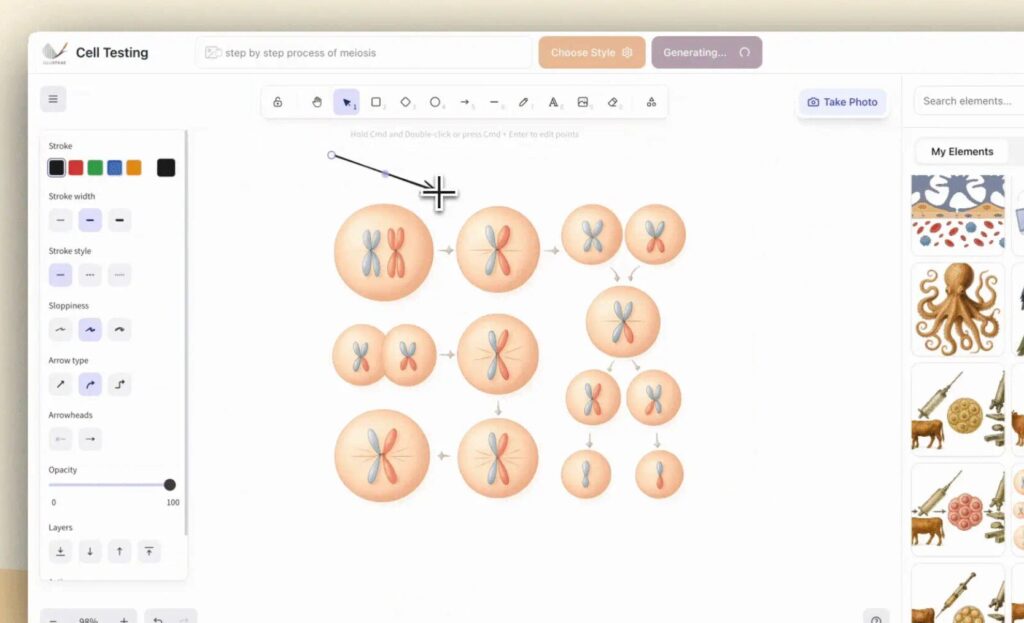
- Scientific textual description : Write “cross-section of a leaf with palisade and lacunae parenchyma” and get an anatomically correct scheme
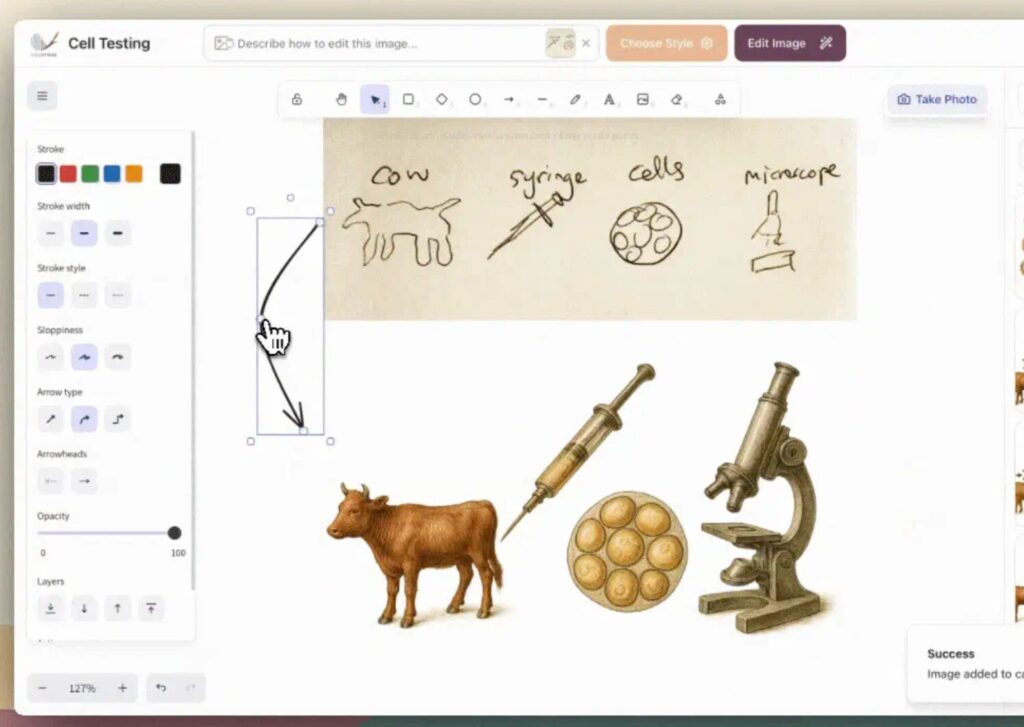
- Transformation of photos : Photograph your TP material or samples to convert them into didactic diagrams
- Sketch improvement : You scan an old sketch scribbled by hand: it becomes a clean image, worthy (almost) of a manual.
The strength of Illustrae? His understanding of scientific vocabulary and academic visual standards. The tool knows that a plant cell scheme requires a cell wall, that an electrical circuit follows precise conventions, that a mathematical curve must comply with certain rules of representation.
Step by Step: How to Create a Quality Science Illustration
Let's take a concrete example in physics-chemistry. You prepare an acid-base dosage TP for your first-graders. The assembly is complex and you want a clear and professional scheme.
Step 1: Precise technical description
On illustrae.co, you type: "Assembly of pH-metric dosing with graduated burette containing NaOH titrating solution, beaker with HCl titrated solution on magnetic stirrer, pH meter with diving electrode, 3/4 section view, volume and concentration annotations"
Step 2: Scientifically correct generation
AI instantly produces a schema that respects:
- Actual proportions of laboratory equipment
- Conventions of representation in chemistry
- The correct position of the pH electrode
- The direction of rotation of the magnetic stirrer
Step 3: Pedagogical adjustments
The intuitive interface allows you to:
- Adjust colors according to your usual codes
- Add arrows
- Zoom in on certain parts to create details
- Adapt complexity to the level of your students
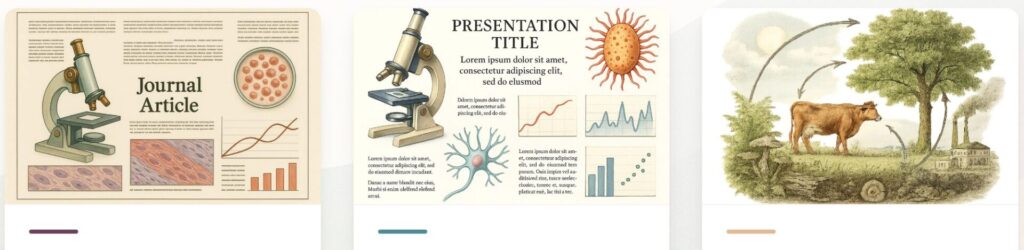
Step 4: Professional export
Export in high resolution (PNG) for your projections or in vector format (SVG) for large format prints. The quality is really at the rendezvous. You'll be amazed.
Concrete applications for all scientific disciplines
This ability to adapt to the needs of illustration applies to all scientific disciplines. Just like the mind maps, it provides valuable support to help your students better understand sometimes complex data.
SVT: From cell to ecosystem
Create histological sections, comparative anatomy patterns, biological cycles, ecological pyramids … One professor testified: "I reconstructed the entire genetics program with consistent patterns. My students are finally visualizing meiosis correctly!
Physics-Chemistry: Visualising the invisible
Represent experimental montages, energy diagrams, 3D molecular models, … force schemes AI includes conventions: vector sense, representation of chemical bonds, standardized symbols.
Mathematics: Impeccable Geometry and Graphics
Precise geometric constructions, graphical representations of functions, 3D figures, statistical diagrams … No need to juggle GeoGebra with other tools!
Engineering technologies and sciences
Technical diagrams, exploded views, organizational charts, logical circuits … Illustrae masters the standards of technical representation.
And if you have an interdisciplinary project, Illustrae follows too. For PPE, presentations, posters, this is great. It includes vocabulary mixes and adapts.
Illustrae rather than Canva?
It is true that the Canva Graphic Studio He knows how to do everything. Canva is excellent for general presentations, posters, simple infographics. It offers a library of varied elements but little real specialised scientific content.
Illustrae has been trained on thousands of scientific visuals. It is in the detail, in the rigor, in the logic of the disciplines.
In short, Canva, for re-entry displays or docs, it is perfect. But when it comes to representing a diffraction or a lens system, Illustrae will save you a lot of time.
The advantages of a solution dedicated to scientific subjects
What really changes life with Illustrae is, among other things, saving time. You actually save time. And not just a little. In 5 minutes, you have a clean visual.
You have scientifically reliable patterns. AI respects scales, legends, conventions. You can adapt a schema with one click depending on the level. From 6th to 6th grade.
Finally, you can create a library of reusable visuals. The latter may even have a common graphic line. You can also share them easily if you work together.
Some reservations to work with peace of mind
Despite its specialisation, AI can make mistakes. AI is good, but not foolproof. Better to check the diagrams: An expert eye, it remains essential.
The more accurate your description is and uses the appropriate scientific vocabulary, the better the result will be. And then don’t get it, you need an internet connection. So, prepare your materials in advance.
The tool is paid for. The subscription starts at 9 Eur per month for around 50 visuals. For 29 Euros you raise this limit. For the teams, the subscription to 99 Eur is very quickly profitable.
Get started with scientific illustration 2.0!
Illustrae is an excellent tool for science education. To discover the possibilities, visit the website of the Illustrae platform.
Start by recreating an illustration that you use often. You will be surprised by the speed and quality of the result. Then explore: create this complex diagram that you did not dare to draw, this 3D visualization impossible to represent in the … table
If you want to give your students clear, fair, and truly scientific visuals, Illustrae is there for that.
“Scientific illustration is a bit like translating the language of science into images that we can all understand.” - David Goodsell, biologist and illustrator