Last updated on February 20, 2019
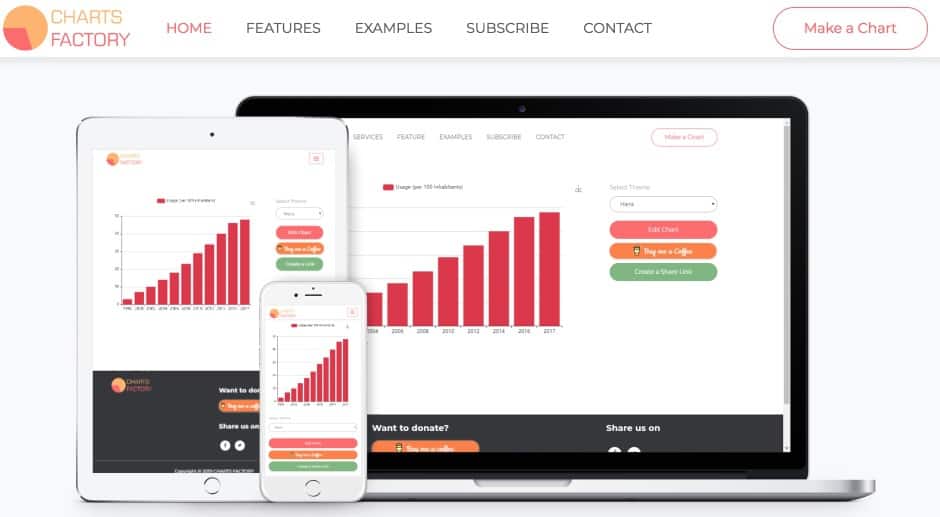
Charts Factory, l‘Graphics plant, is a CTBT tool as I like them. Simple, convenient and completely free. Charts Factory an excellent online graph generator that will allow you to create all kinds of graphs to visualize a dataset.
Graphs are increasingly used to visually represent datasets. Essential elements to analyze and understand or make understand a fact from raw data. Ideal to be able to insert them in a blog, a presentation, a PowerPoint, an infographic. There are many tools to create infographics easily. This responds to a real need.
Let anyone who has never fought with a spreadsheet and spreadsheet to get a chart raise their hand. Charts Factory really changes the game by making the creation of charts available to everyone.
Easily create a graph from a template
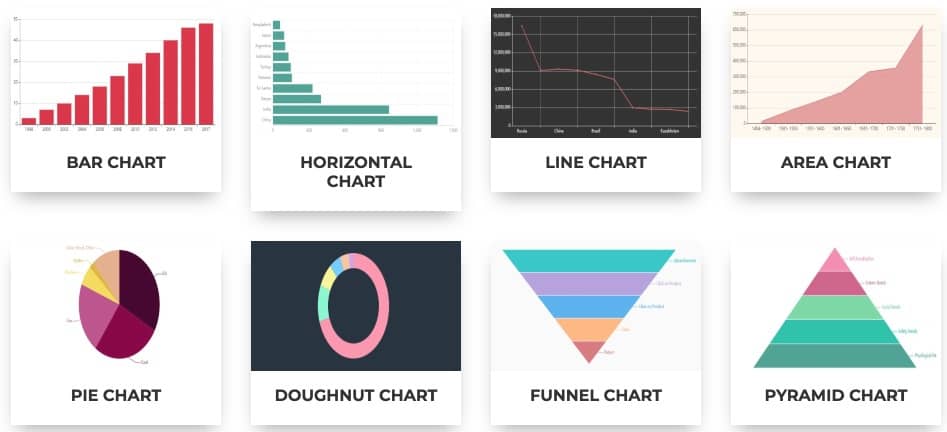
Charts Factory offers you a whole series of ready-to-serve models that you will be able to customize. You also have the choice between a good dozen types of graphics: Stick diagram, circular, camembert, … histogram
Simply choose the type of chart that best matches the visualization you want to create. Don’t worry, once you have entered your data, you can switch from one type of chart to another with a simple click without having to re-enter everything.
Give your chart a title, choose the colors and fill in the boxes with your data. All that remains is to click on ‘Generate’ and your data will come to life in the form of a beautiful graph.
Easily shareable custom graphics
Your custom graphic barely created you will be able to share it as easily in two steps, three movements. Charts Factory provides you with a unique link for sharing by email or on social networks. But above all, the platform allows you to download your graph to your computer in .PNG image format. All you have to do is insert it into a course or PowerPoint.
The best for the end. Charts Factory can be used for free by you or your students unlimitedly. The icing on the cake, you don’t even need to register.
Link: Charts Factory