Last updated on 12 May 2026
You don’t have to be an auspicious bird to see that the period we are living in is filled with noise, fury, fears and threats. You just have to follow the news to see it. Measuring and knowing the big threats well are good ways to combat them without oversizing them but also without denying them either.
Maps, interactive infographics make it possible to show the major global phenomena and their evolution in real time. Here are three good examples. Three interactive global maps quite remarkable for taking stock of three major current threats.
Table of Contents
Lightpollutionmap. An interactive map of light pollution
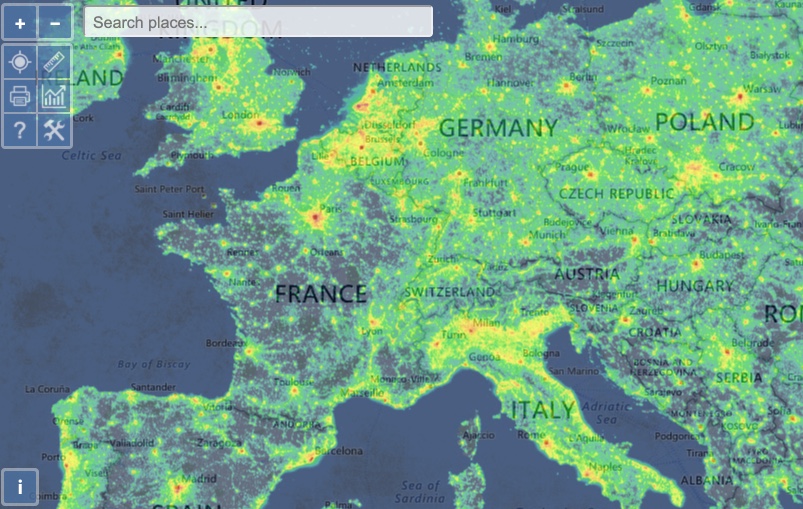
At night, it is increasingly difficult to see the stars, partly because light pollution on the ground prevents us from enjoying the show. In this interactive map you will discover light pollution and high concentrations of human activity. A fantastic interactive map that allows the passage to better understand the distribution of humanity on our planet.
Link: Lightpollutionmap
Transparency. A map of corruption around the world
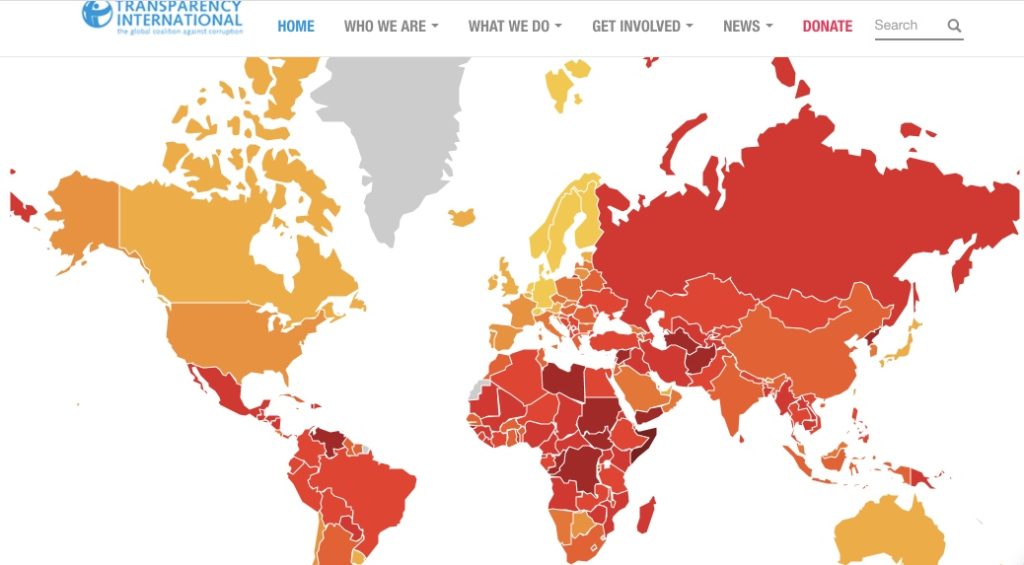
After the environmental problems, here a map that addresses one of the problems in the field of politics and democracy, that of corruption. Every year, the NGO Transparency International publishes an interactive map that gives an idea of the level of corruption in each country of the world. The organisation publishes a ranking with the score of each, also allowing to see the historical evolution of each country in this area.
Link: Transparency International
Coronavirus Map. An interactive map of the real-time spread of the disease
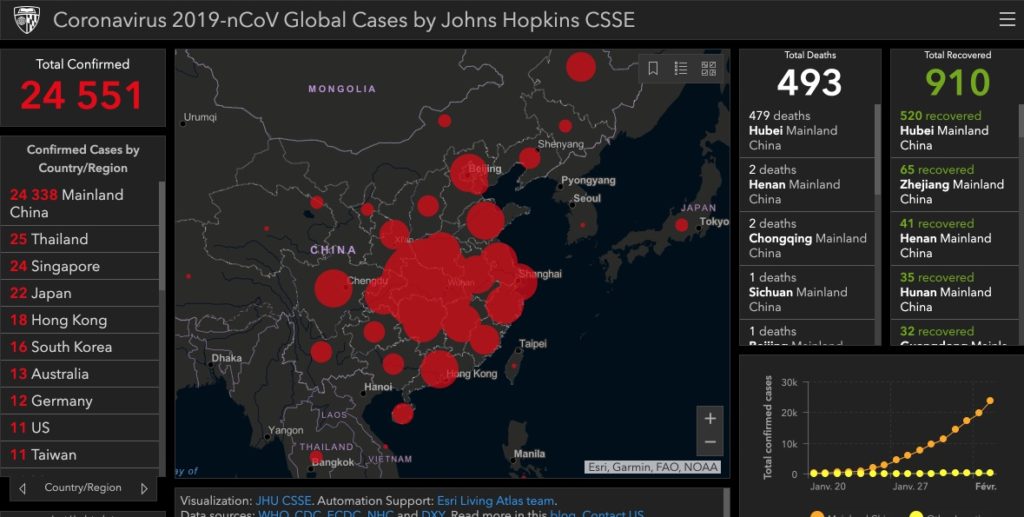
Our health in the spotlight with this card monitors in detail the evolution of the Coronavirus outbreak born in the city of Wuhan in China. This map uses data from the World Health Organization, the Center for Disease Control and the National Health Committee of the People’s Republic of China. It is updated daily, sometimes more than once a day. The figures given here make it possible to measure the evolution and spread of the disease. All this data has something to worry about but it also allows reason to keep and fight rumors and other fake news. The map publishes in red the number of deaths due to the disease but you will also see numbers in green. They count people with the disease who have cured it.
Link: Coronavirus Map

2 Responses
[…] of healings, number of new cases … You then have a visualization through the geographical maps of the disease. Finally, a wiki lists all serious and verified sources about the disease. Beautiful […]
[…] Also read: 3 interactive maps to follow three major plagues. […]