Last updated on 2 June 2026
There are days when we would like to see the preparation of a course boiled down to a clear intention. I want a simple map of the capitals of the G7. I want to visualize the stages of the Silk Road. “I want to show the biggest metropolises in Europe.” And it’s done.
In practice, making this type of support takes time: find the right data, check, place points, make everything legible and presentable. This is the same promise as other AI tools “support production oriented”, e.g. Napkin which transforms a text into pedagogical visuals.
CartaGen is a Free AI Card Generator. The principle is simple: you write a description in natural language, and the tool generates a interactive map from your request, directly in the browser.
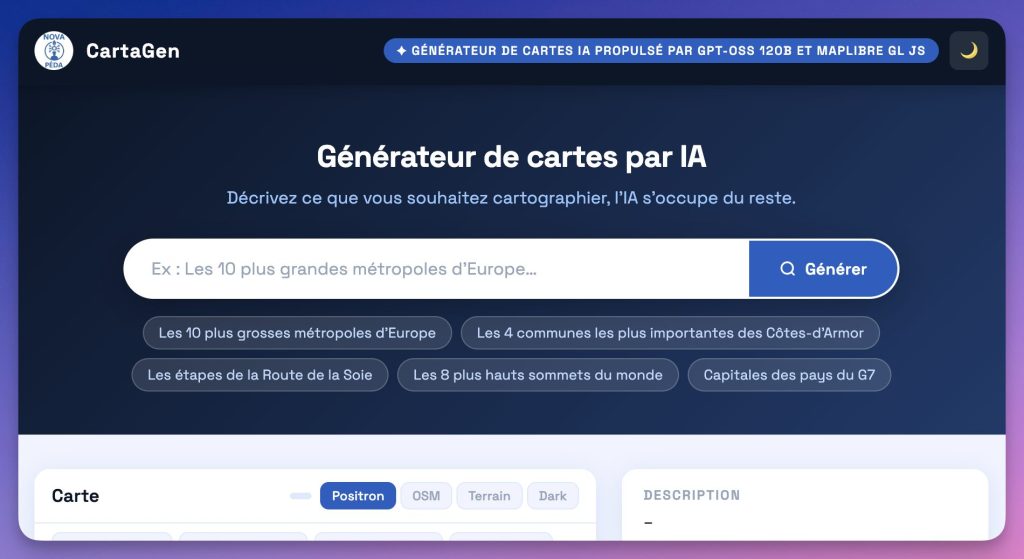
Table of Contents
An open source tool, and it makes a difference
Let’s start with what is worth highlighting: creators demand an open approach, in the minds of Digital Commons, and CartaGen follows this logic.
Why is it important? Because a tool open source (or, more broadly, backed by open technologies) often offers more than transparency, more than durability, and more opportunities for reuse and dadaptation.
For teachers, it is also a way to avoid relying solely on services. opaque, whose rules may change overnight.
Immediate handling: we write, we generate, we adjust
On its page, CartaGen announces that it is "powered by GPT‑OSS 120B and MapLibre GL JS ". . . Concretely, AI interprets your query and produces a map displayed with a modern map library.
The interface goes straight to the point: an input field, a generation button, then a display on a map background, with several styles (Positron, OSM, Terrain, Dark).
The tool also offers a Refine mode. And that’s important, because in the classroom you don’t always ‘fall’ just the first time. Being able to reformulate, specify, correct a … entry is exactly what makes the tool useful on a daily basis. This logic “I generate and then adjust” can also be found in Caramel, another tool I had presented to create H5P activities from documents.
Obvious scenarios in geography, history, EMC
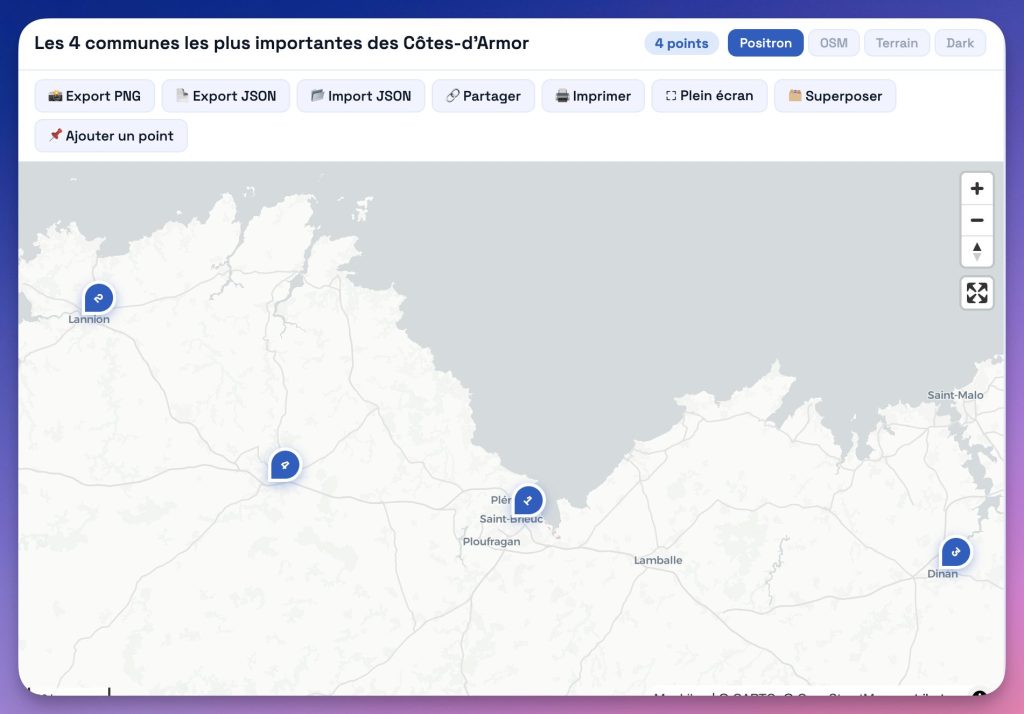
CartaGen provides ready-to-launch examples typical of classroom use: G7 capitals, major metropolises, summits, Silk Road.
It can be used as visual support fast, but also as a starting point for more interesting work: Explain the criteria, question the choices, discuss the limits of an “automatic” list.
It is also a good tool for working on a skill that is rarely tackled head-on: make a specific request.
Keep hands: Editing of dots and overlaying of cards
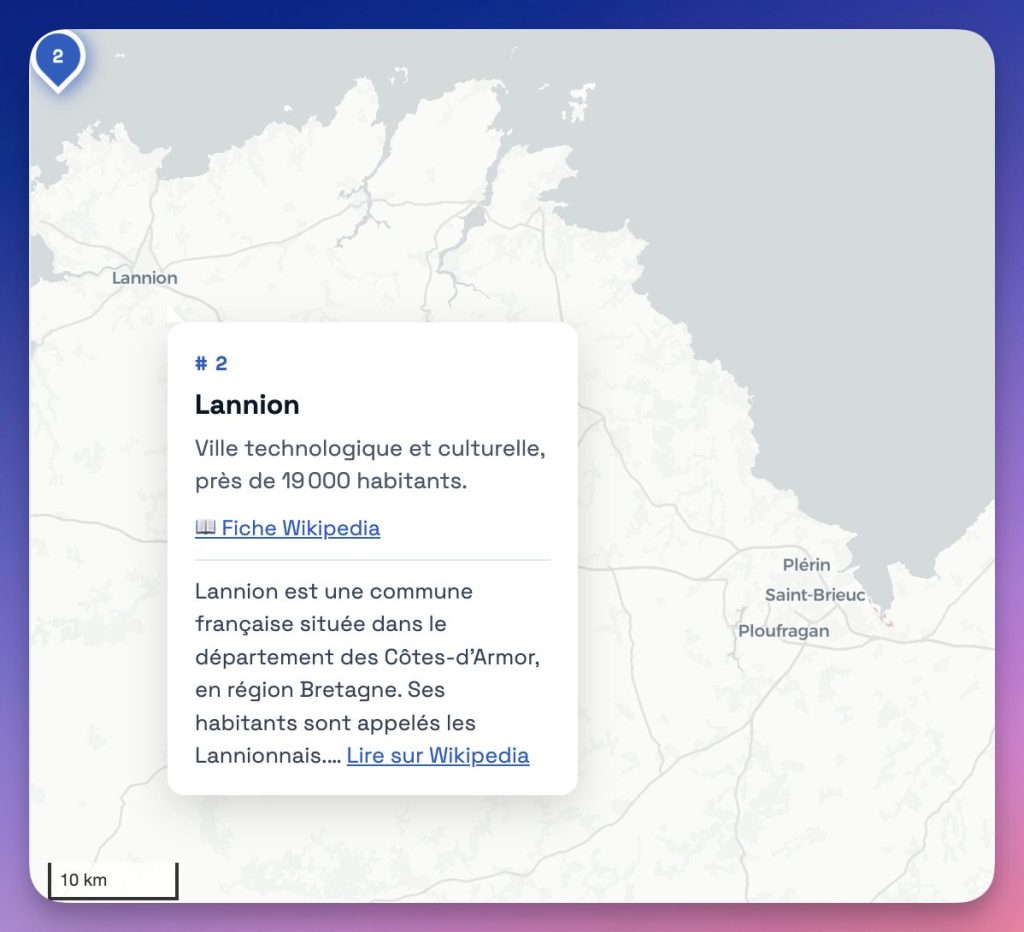
What reassures you, in a pedagogical context, is that the tool does not lock you into a fixed result. CartaGen offers an editing method: you can add a point, change its name, description, contact details, or delete what does not make sense for the target level. This possibility of retouching changes everything: it makes it possible to transform a generated result into a truly controlled support.
Another high-potential feature: the overlaying of cards. The idea is to generate a second card from another query, then superimpose it on the first, playing on opacity and on an addition or subtraction mode. To compare two sets of information and start a classroom discussion, this is a very interesting track.
Sharing and exporting: teacher-friendly options
Exploitation in the classroom has also been pragmatically designed. We can go full screen to project, share by link (without account), export to PNG for a slideshow, and save the work in format JSON to take it over or change it later. If you then need to distribute a “clean” medium in the form of a leafable document, you can also look at Publuu, which transforms a PDF into an interactive flipbook.
The right reflex: a generated map is not a source
As always with an AI, it is necessary to keep a simple rule: a generated card is a support, not proof. Proper use is to check, correct, discuss, and possibly ask students to identify what merits confirmation.
It's up to you: Link to CartaGen
3 prompts to test CartaGen in class
To tame the beast, here are three concrete requests to copy and paste into the CartaGen input field. They illustrate the diversity of displays (points, roads, areas).
A small detail that changes everything: if your instructions are sketchy (breakdown, return to the line, etc.), a passage by Convert Case allows you to clean it before gluing it.
- Geo-economic scenario:
Places the 10 largest ports in the world (in tonnage) with red markers and displays a Wikipedia sheet for each.- Interest: Instantly visualise Asia’s dominance over global maritime trade.
- Scenario History / Geopolitics:
‘Plots the route of the Mao Zedong Long March in China with the main stages between 1934 and 1935.’- Interest: Transform a linear narrative into a dynamic spatial trajectory, ideal for a projection on TNI.
- Urbanisation scenario (Heatmap):
‘Shows a heat map of the most densely populated areas in Western Europe.’- Interest: Go from simple point to the notion of urban "tablecloth" or European megalopolis in one click.
In the end, CartaGen fits well into this family of tools that save time on the production of the medium, while leaving the responsibility for the content to the teacher. And the fact that the project is open source The following should be commended: in education, it is a choice that counts.