Last updated on 12 May 2026
Graphy is an online tool that allows to create data charts easily and partly for free. Since my last article, this platform has evolved considerably by integrating artificial intelligence, becoming a real assistant that turns data into impactful visualizations.
A tool that goes straight to the point and now offers the possibility of automatically obtaining the best graphical representations of your data, with relevant analysis and information as a bonus.
Table of Contents
How to Create a Graph with Graphy
Graphy turns your raw data into professional graphics in three clicks. The principle is disarmingly simple:
- You import your data – Whether by copying and pasting from Excel, importing a CSV file, or directly linking a Google Sheets sheet, Graphy accepts all common formats. You can even type your values directly into the interface.
- AI analyses and proposes – This is where the magic happens: Artificial intelligence looks at your data and automatically generates the three most relevant graphs. No more long minutes hesitating between a histogram or a curve!
You customize and export – Adjust the colours, add annotations to highlight the important points, and then export your graphic in the format of your choice (image, presentation, … document).
Result : What used to take hours on Excel is now done in minutes, with a professional rendering. A real time saver.
Artificial intelligence for data visualisation
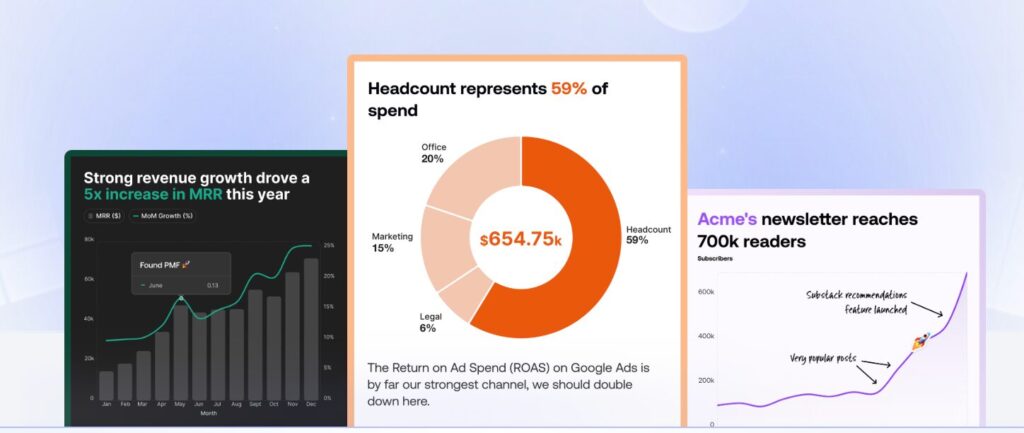
Graphy’s big novelty is therefore Graphy AI. Gone are the days when you had to manually choose the type of chart that suits your data. The tool now automatically analyzes your data and instantly offers you the three best possible charts, along with eye-catching headlines and key information.
There is no need to ask what type of graph is most suitable to illustrate a geography, economics or science course. AI helps you make a relevant choice.
Multiple data sources for more flexibility
Graphy has significantly expanded its data import options. You can now:
- Link directly a Google Sheets (ideal for evolving data)
- Import CSV or Excel files
- Paste or type your data directly
- Using the API for advanced integrations
and even ask the AI of the platform to search for data for you.
The latter feature is particularly useful for preparing courses: Imagine being able to ask Graphy to find and visualise data on global population trends or CO2 emissions by country.
Dialogue with your data
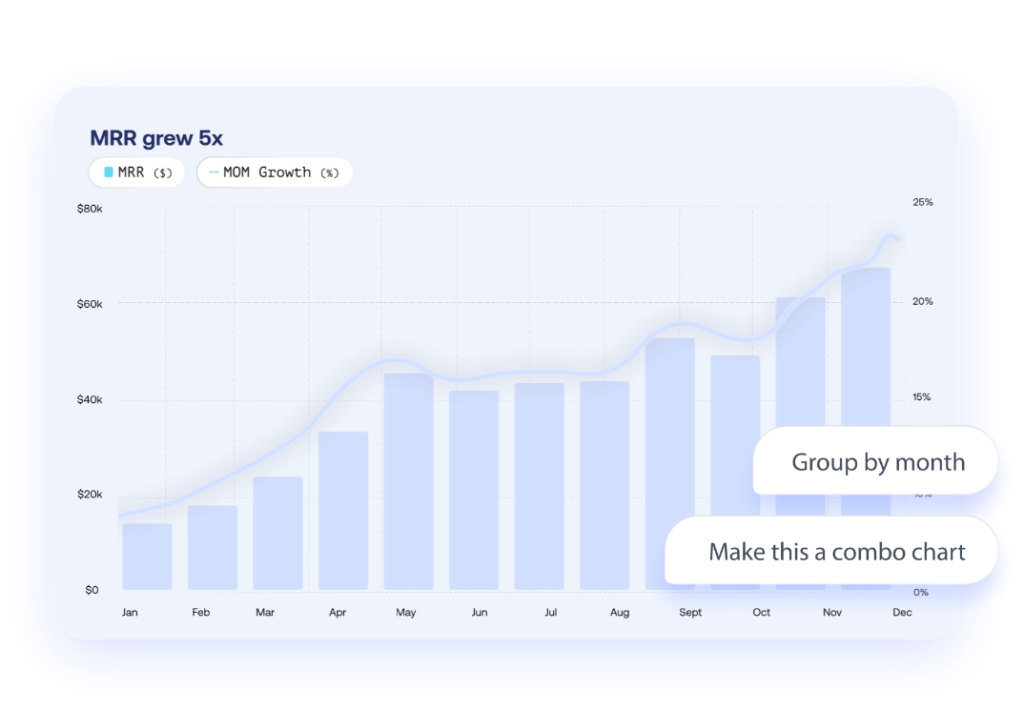
The other major innovation is the ability to “chatter” with your data. You can ask questions in natural language like "What's the trend over the last 5 years?" "Which month saw the strongest increase?" or "Which month saw the strongest increase?" AI analyses your data and responds to you with the appropriate graph.
For students, this is a great way to learn how to Analyze and interpret data interactively.
Simplified professional customization
Graphy now allows you to instantly apply your graphic chart (colors, fonts, style) to all your graphics. You will be able to create coherent visual supports for your courses, presentations and all your publications.
The tool also offers annotations to highlight key points, making it easier for students to understand.
Export formats adapted to all pedagogical uses
Beyond the simple PNG export, Graphy now adapts to most needs:
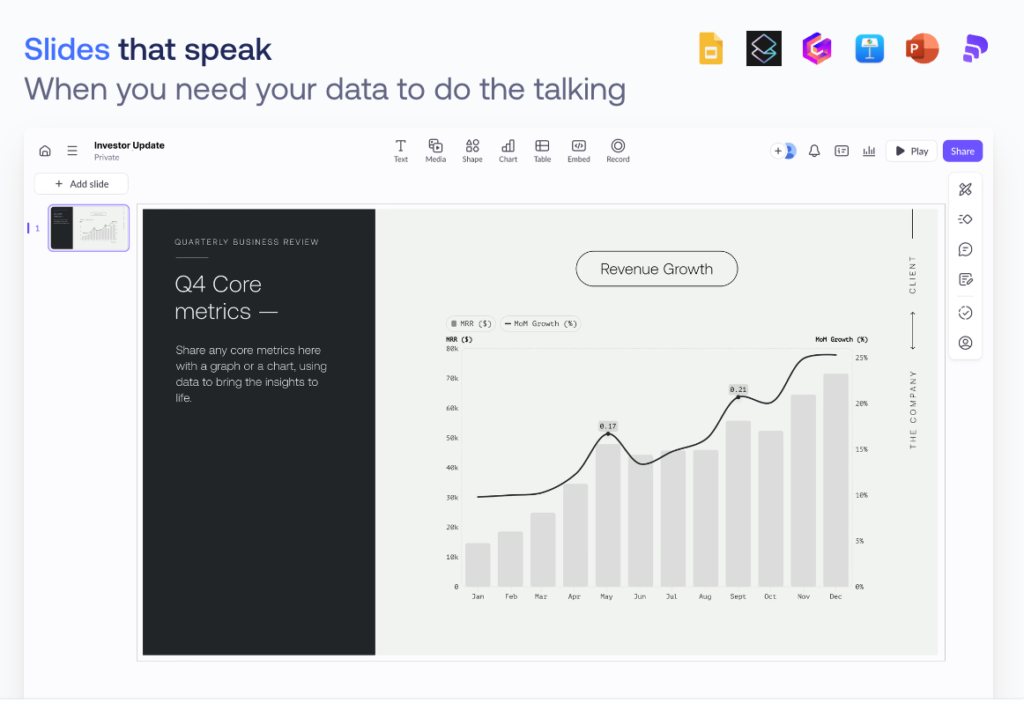
Slides : for generate presentations impactful.
Documents : direct integration into your course materials.
Embed : to integrate graphics into your blogs or classroom sites.
An enriched graphics library
Graphy now offers a wide range of graphic types: horizontal bars, stacked graphs, multiple lines, funnels, heat maps, sector graphs, time series, Likert… scales What to meet all pedagogical needs, from mathematics to social sciences.
For responsible school use
Like any digital tool using AI, Graphy requires some precautions for use in school contexts. Here are some essential points to keep in mind in my opinion.
Protection of student data
It goes without saying but it goes better by saying it, Graphy being an online service, it should never enter personal or nominative data about students. Always use anonymized data (Group A, Student 1 …).
AI as an assistant, not a crutch
While Graphy’s artificial intelligence greatly facilitates the creation of graphs, it should not replace fundamentals learning. I like this idea of an AI that should be used as an assistant and not as a bequille. Students must first understand why to choose this or that type of chart before letting AI make proposals.
Developing critical thinking
The automatic insights offered by AI are avenues for analysis, not absolute truths. Encourage your students to question these interpretations, check them out, and come up with their own analyses. An opportunity to develop their critical thinking in the face of AI tools?
In practice for education
Graphy remains free for basic use, without mandatory registration, for five visualizations. It is the ideal tool for (among others):
- Illustrate courses with up-to-date data
- Have Graphs Created to students during practical work
- Analyze the results of surveys or scientific experiments
- Present statistics in an attractive way during class councils.
In addition to this free version, which makes it possible to create five graphics, subscriptions for intensive and unlimited use of the platform are quite expensive. Count around 20 euros for one month.
Creating charts for everyone?
The Graphy Platform has evolved over time by intelligently integrating AI to further simplify the creation of graphics, while maintaining its initial philosophy: make data visualization accessible to all. A really interesting resource for, among others, enrich your courses with visualizations relevant and aesthetic data.
1 Response
[…] concepts and information more accessible to students. Picyard offers simple and intuitive graphics creation features. Simply choose the model that suits you to enter the data. […]