Last updated on 12 May 2026
How to make an online diagram? There are many uses. The tools too. Here are five solutions, from the simplest to the most complex, that make it possible to make visual and structured representations of a mass of data:. 5 tools to better visualise a series of concepts, ideas, statistics, raw data.
Cacoo
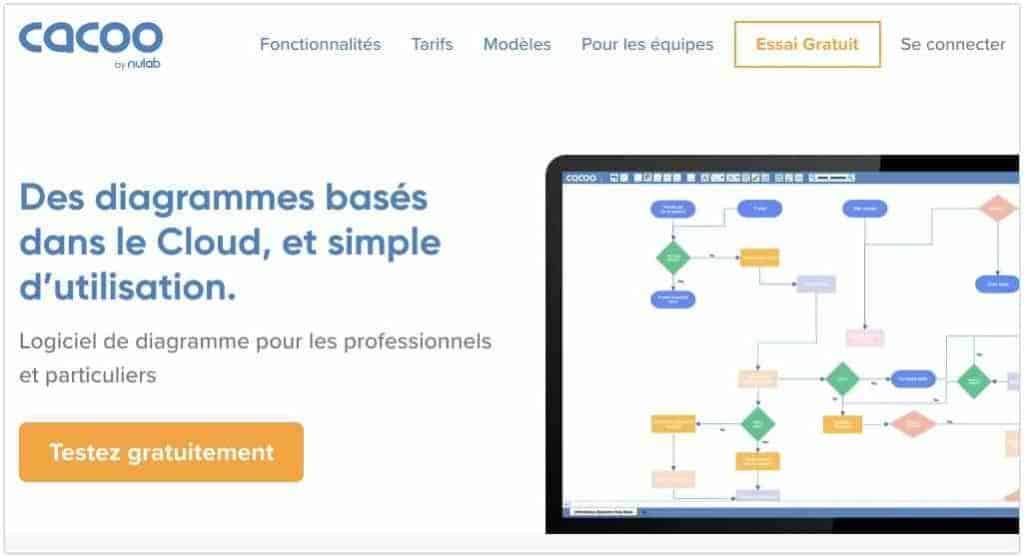
Cacoo is a tool that I have already mentioned here that makes it possible to create diagrams online alone or collaboratively. The tool does not require any downloads and makes it possible to create high-quality representations. Its main asset, a simplicity of use that makes it accessible to all. Cacoo allows you to start from a blank sheet or use one of the many models that can be adapted to your own needs with a few clicks.
Link: Cacoo for Education
Diagramiq

Diagramiq also plays the card of collaboration and teamwork to create a diagram. It is a great tool to capture and link your ideas into beautiful diagrams with real ease. It offers a large collection of shape libraries with virtually unlimited style options. For teamwork, Diagramiq makes it possible to work together in real time on any project. An integrated chat also facilitates communication between participants.
Link: Diagramiq
Drawio
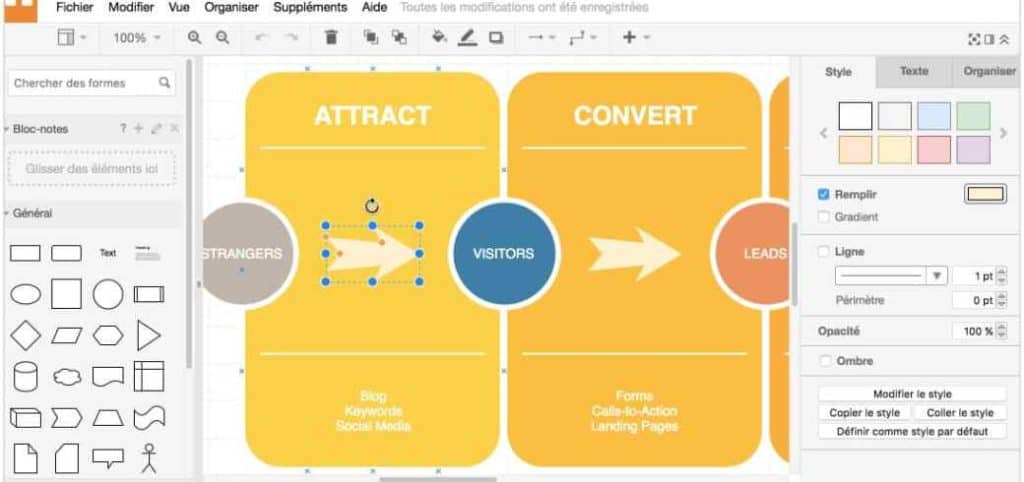
Already old, Drawio offers a free solution for drawing a diagram online. Drawio does not lack strengths in the face of often more complex and mostly paid competitors. Easy to handle and use. It offers many models of shapes and pictograms that you can use freely. Its diagrams are compatible with many tools and are exportable in most useful formats. It is free and ad-free.
Link: Draw.io
LucidChart

It's hard not to slip into this LucidChart list. A complete solution to make a diagram or schema professional. LucidChart is an online tool to easily create a diagram, an organization chart, a diagram or a mental map. Lucidchart combines ease of use with advanced functionalities to meet all needs at school or in training.
Link: LucidChart
ChartGo
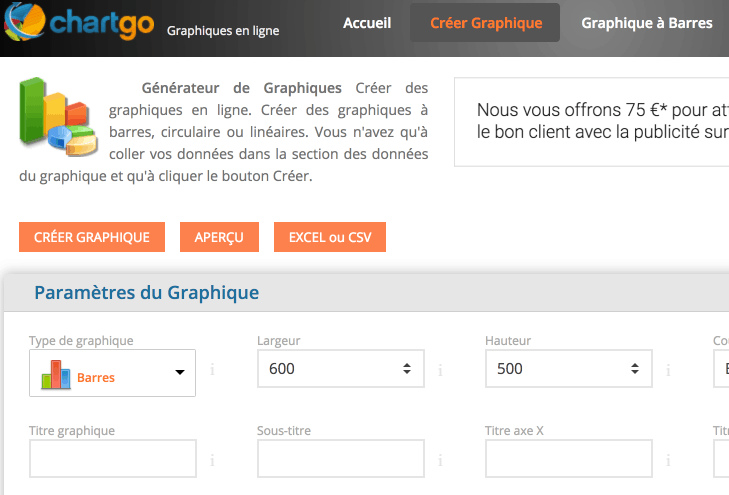
A small place for ChartGo in this small list of five tools to make an online chart or graph. You can create bar, linear, circular and surface charts. Simply paste your data into the data section of the chart and click the Create button. The tool is free, but with advertising.
Link: ChartGo
 English
Arggh, I see this one day too late.
Just yesterday I struggled with Canva to quickly create a diagram.
And it wasn't easy.
Thanks for the resources.
I also offer GitMind , online tool that allows you to create your diagram for free and easily