Last updated on 12 May 2026
We know the song "A picture is worth a thousand words" From this point of view, the online CTBT tools that have appeared in recent months to create infographics play an important role. Difficult to decide the best current tool. Here are ten of them.
10 online tools that make it easy to create infographics to convey the content of information in a visual and more attractive way. All were featured on ToolsTice.
1 – PikToChart
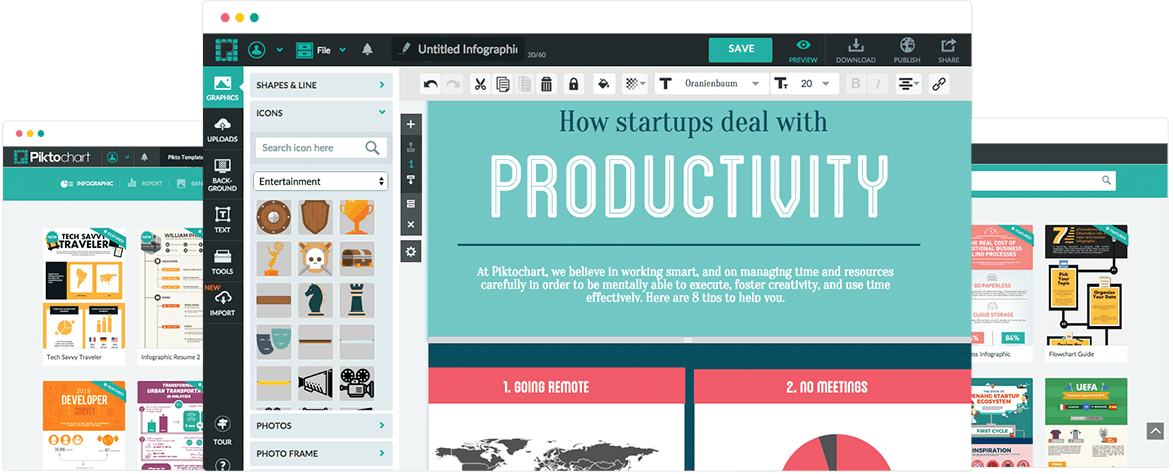
Piktochart is a great tool for creating high quality infographics. I presented it in An article here. A vast collection of templates makes it possible to give substance to your presentations by customizing them in a few clicks. Piktochat is one of the leaders in this sector. A deserved success.
2 – Tiki - Toki
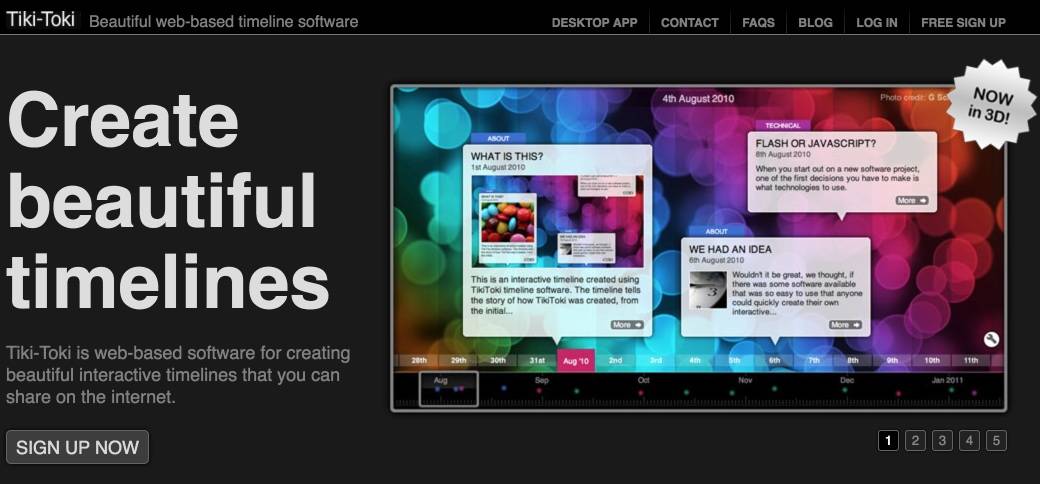
Tiki-Toki was in the spotlight on Tools TICE Just last week. It is probably the online tool that makes it possible to create the most beautiful chronological friezes or timelines.
3 – Venngage
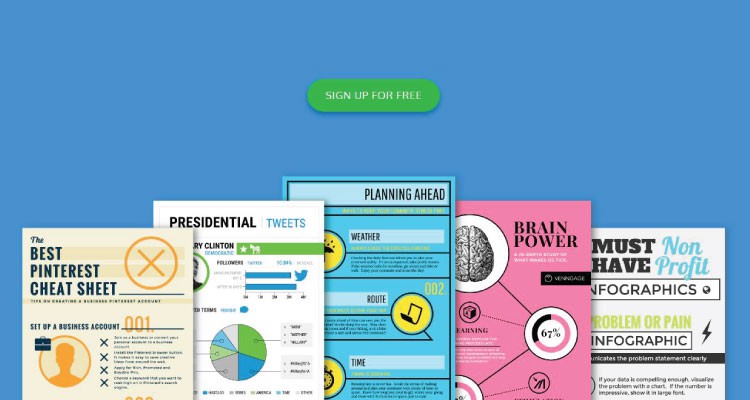
Venngage is a tool that allows you to create beautiful infographics with real simplicity. You can read thearticle I dedicated to him a few weeks ago. Venngage makes it easy to create a whole series of infographics in minutes, which you can then insert into a website or blog.
4 – Wordle
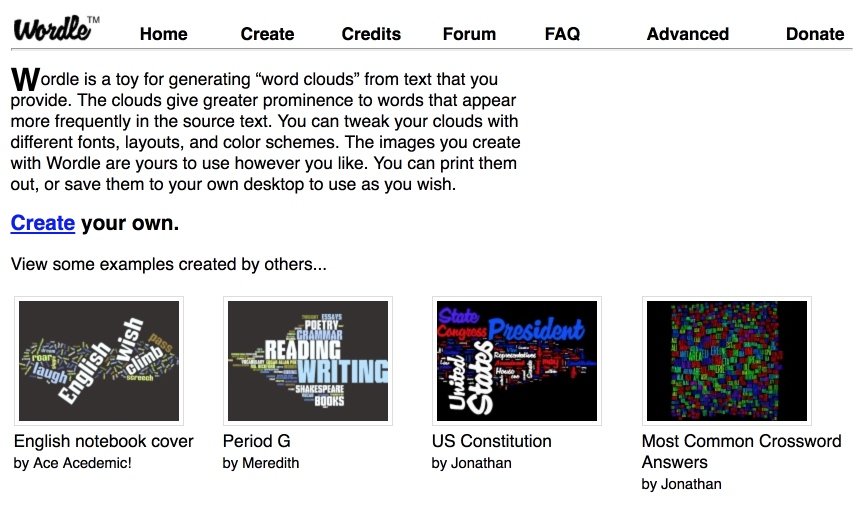
I have a soft spot for Wordle. He is one of the pioneers in the field. Wordle makes it possible to create three movements of word clouds from text in two clicks. It was part of a list of four online tools to create word clouds presented on TICE Tools.
5 – Canva

Canva had to be on that list. If you are looking for the heavyweight in the sector, you have found it. Canva is the go-to tool. It allows everyone to make relatively simple beautiful infographics. Canva is free and You can even test without any commitment the professional version for free for 15 days.
6 – Easel.ly
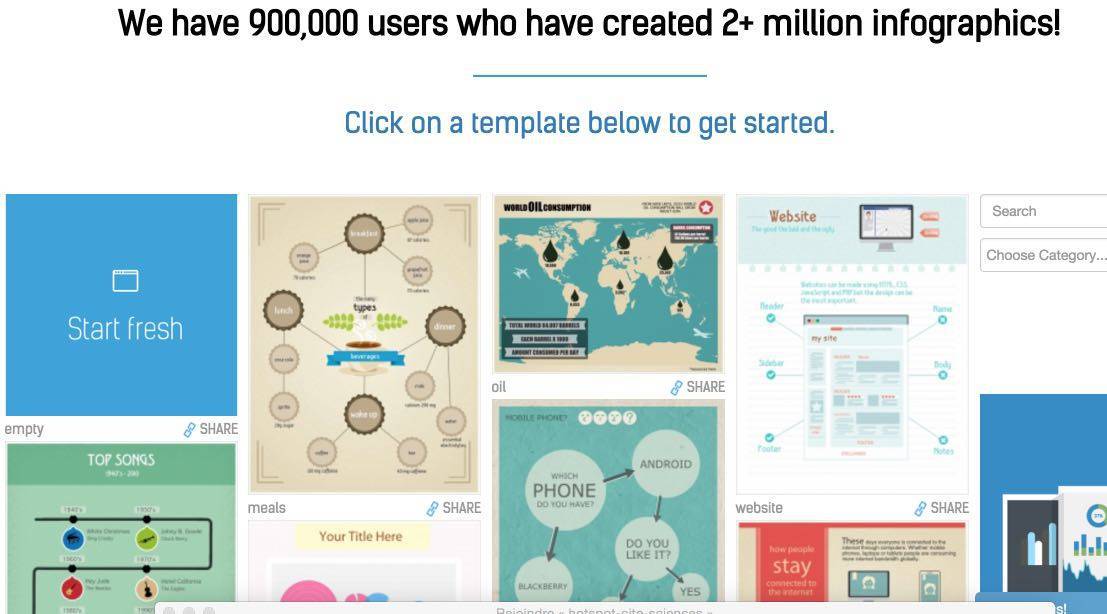
As its English name suggests, Easel.ly is particularly simple to use even for a perfect beginner. Promise held, this free tool offers a significant amount of templates or templates ready to serve.
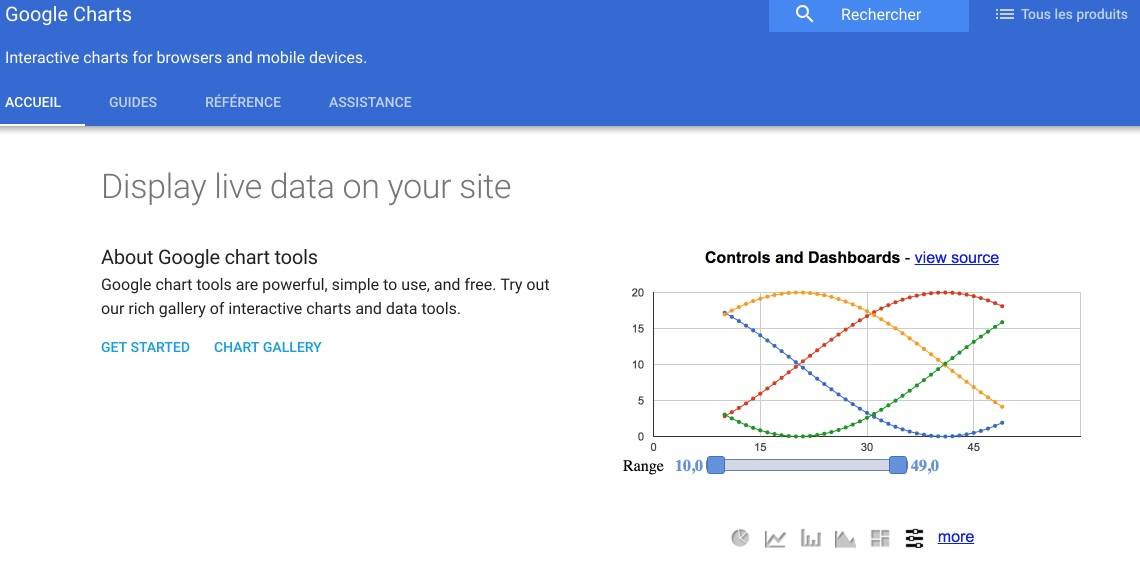
A very serious tool made in Google. Chart Tools is a very complete free tool. It will allow you to choose and format many types of charts from your data. Chart Tools allows, among other things, to create interactive infographics that update in real time.
8 – Infogr.am
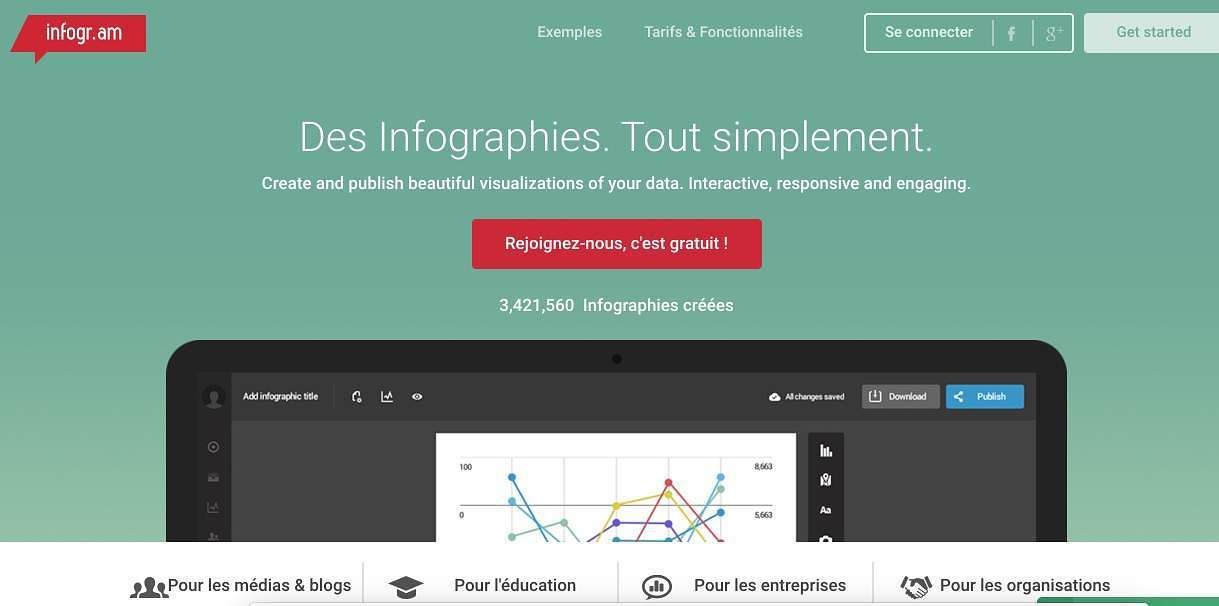
Infogram is very easy to use. The tool provides you with a list of ready-made templates that you will be able to customize as you wish. You can connect dynamic data to it for infographics that will update themselves.
9 – Visme

Another tool that works wonders to create visualizations and infographics that you will not have to blush. Visme works like his little comrades from templates that you can customize. Among other things, it allows you to create beautiful impactful slides for your presentations. I have presented it here on Tools TICE.
10 – ChartBlocks
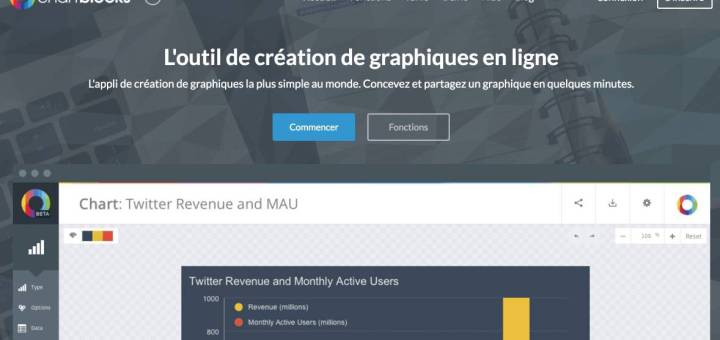
Last of this list, but it was the subject of a presentation on ToolsTice a few days ago ChartBlocks is hardly the simplest online graphics application in the world. It is not far from achieving this.
What about you? What tools do you use to create an infographic?
If you have never embarked on an adventure, try one of its tools. You will be surprised by the result, whatever your level of graphic design or computer science.

Best thanks to the author who offers these tools. I have noticed that the most interesting sites nowadays prefer infographics. Maybe it’s time to start too.
Thank you for the suggestions. To create my infographics I usually go through LucidChart or Prezi, which are very versatile. You can create both infographics, mental/heuristic/conceptual maps, technical diagrams and course notes. Big advantage: editing can be done in synchronous mode.
Thank you!! It’s great this concentrate of tools!!
Thanks for all these tools! what a great job:-))
My personal Picktochart, which I love! and canva, which I use less, I have to look at the others: